 Figure 1:
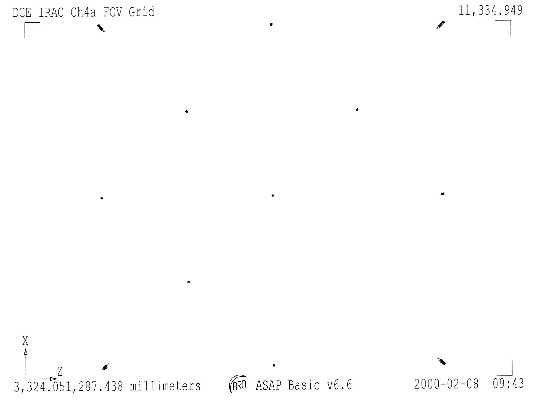
Basic Ray Trace, Split=0; 816 rays, all reach detector. No ghosts
possible.
Figure 1:
Basic Ray Trace, Split=0; 816 rays, all reach detector. No ghosts
possible.IRAC Channel 4 - Point Source Ghosts
Dennis Charles Evans
Evans Engineering
February 2000
This data is a summary of ASAP models of IRAC Channel 4.
"IRAC-Ch4a.ent" creates a 10 x 10 grid at each field position. Of the 100 rays created at each field position, 68 rays get through Telescope at each Field Point; 12 x 68 = 816 Rays)
Figure 1:
Basic Ray Trace, Split=0; 816 rays, all reach detector. No ghosts
possible.
Rays Flux
816 0.184062E+07
 Figure
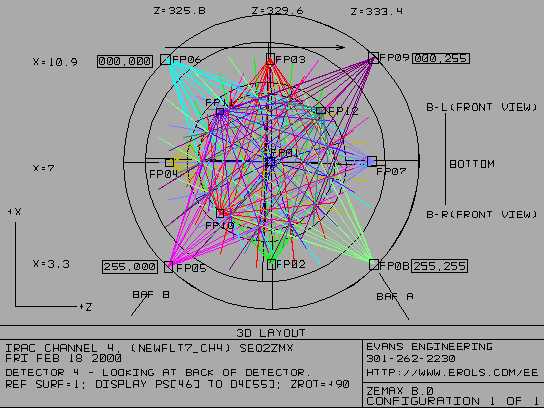
2: Labeled ZEMAX L3d display
Figure
2: Labeled ZEMAX L3d display
This is a Layout 3d image of the Channel 4 detector generated by ZEMAX. This view was selected to match the default views of Channel 4 generated by ASAP. Be very careful when considering pixel and image alignment. There are mirror inversions between channels in the same sets (1 & 3 and 2 & 4) and it is unlikely that all the images available are displayed in the same 000,000 to 255,255 orientation. I had to add the ID sources behind the Detector and carefully measure the dimensions in 3D space to get the orientations to be consistent. The labeling on this image represents the third careful attempt (the first two seemed right, but were inconsistent with the rest of the images.
This is the equivalent of a view through the back of the Detector. The incoming light is moving out of the computer screen toward you.
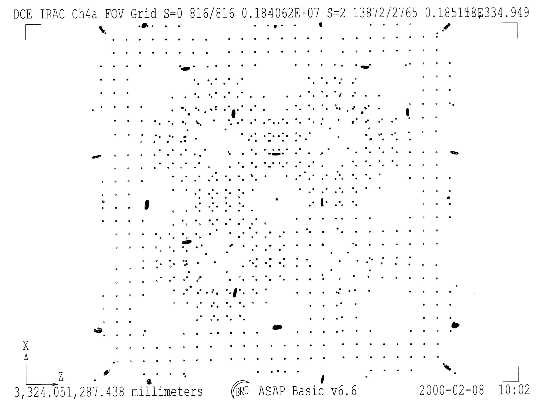 Figure 3: Images
and Ghosts with Split = 2
Figure 3: Images
and Ghosts with Split = 2
TITLE DCE *IRAC Ch4a FOV Grid
S=0: 816 of 816 Rays reach Detector; 0.184062E+07 Flux
S=2: 2765 of 13872 Rays reach Detector; 0.185158E+07 Flux
(0.185158E07 -0.184062E07)÷0.184062E07 = 0.00595452 ghost fraction
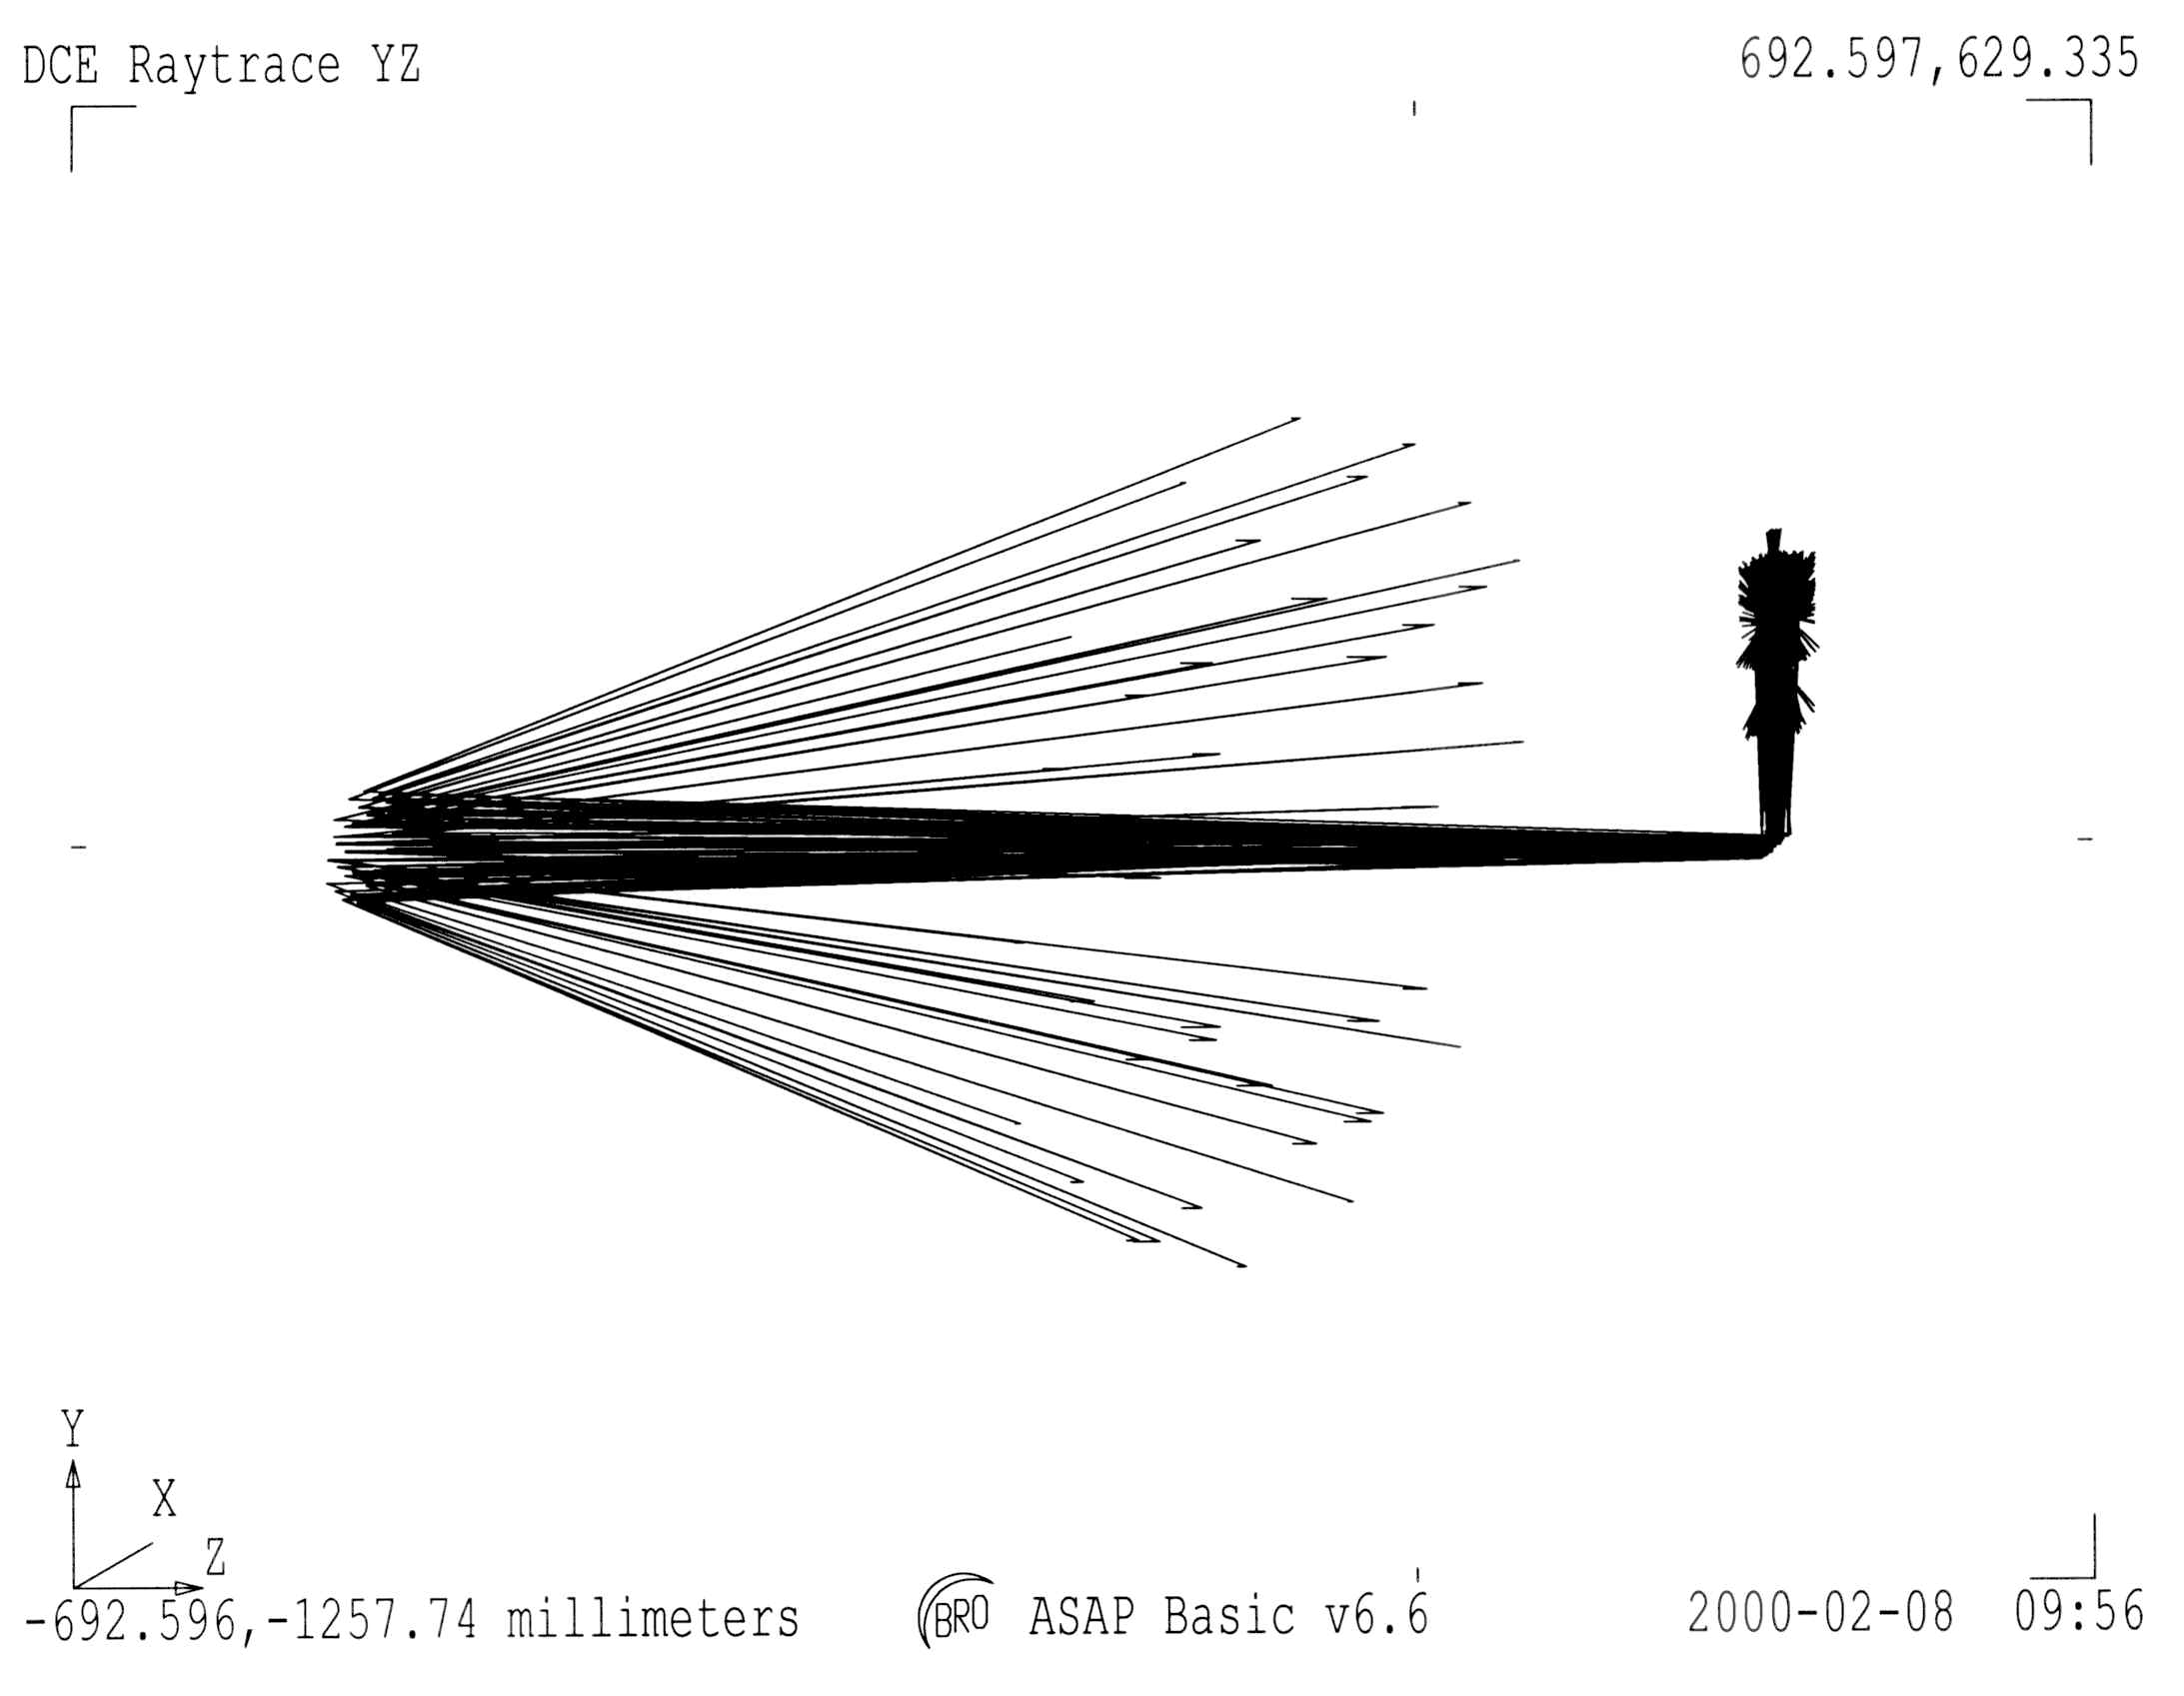 Figure 4: The Ghost Raytrace
Every 10th ray is plotted. Rays that exit the system are truncated at 50 mm from the last surface.
 Figure
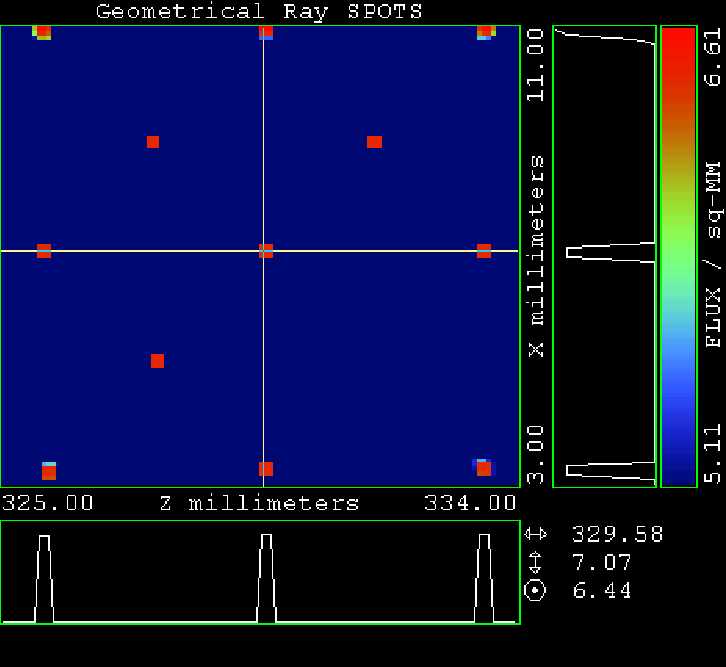
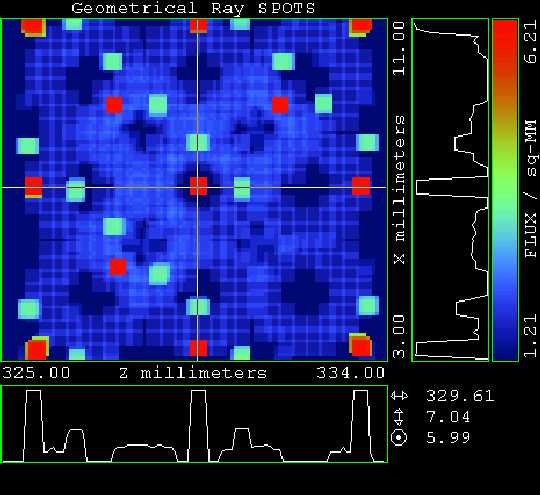
5: Picture with Split = 0 Form = -1.5
Figure
5: Picture with Split = 0 Form = -1.5
This is a logarithmic display of the flux levels from the peak, truncated at 1.5 orders-of-magnitude below the peak. The lowest signal displayed is about 3% of peak.
There is now detectable difference between the Split=0 (no ghosts) or Split=2 (ghosts) Pictures at Form = -1.5
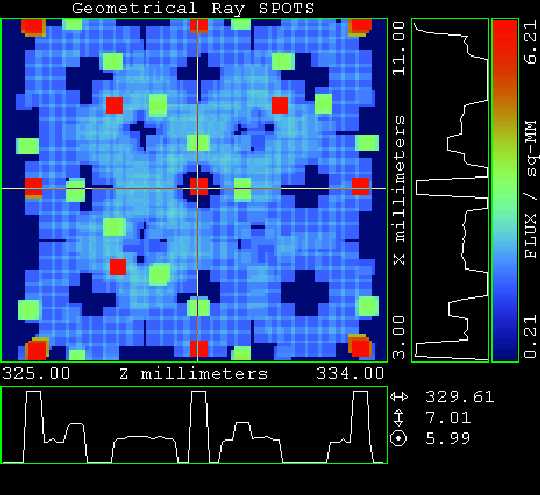
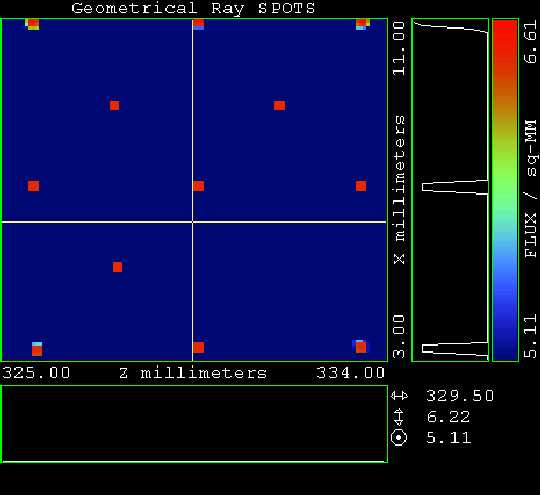 Figure
6: Picture with Split = 2 Form = -1.5
Figure
6: Picture with Split = 2 Form = -1.5
This is a logarithmic display of the flux levels from the peak, truncated at 1.5 orders-of-magnitude below the peak. The lowest signal displayed is about 3% of peak.
There is now detectable difference between the Split=0 (no ghosts) or Split=2 (ghosts) Pictures at Form = -1.5
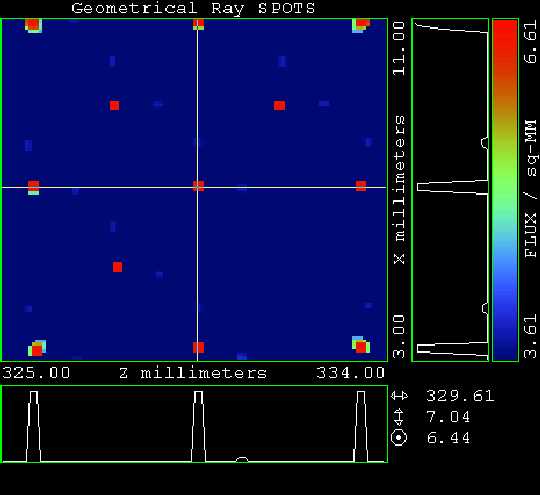 Figure
7: Picture with Split = 2 Form = -3
Figure
7: Picture with Split = 2 Form = -3
This is a logarithmic display of the flux levels from the peak, truncated at 3 orders-of-magnitude below the peak. The lowest signal displayed is 0.1% of peak.
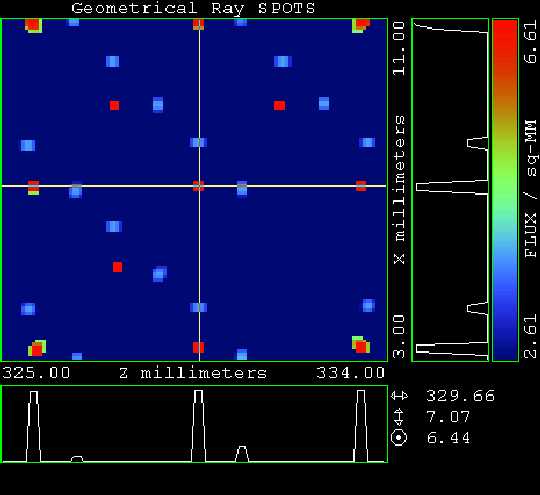 Figure
8: Picture with Split = 2 Form = -4
Figure
8: Picture with Split = 2 Form = -4
This is a logarithmic display of the flux levels from the peak, truncated at 4 orders-of-magnitude below the peak. The lowest signal displayed is 0.01% of peak.
The point source ghosts related to the beamsplitters are above the main point source image. The filter ghosts are located to the right. These ghosts are matters of fact. They will occur in transmission optical systems. They cannot be eliminated, except by eliminating the optical elements that cause them. The ASAP model uses a 5% surface reflection, which is equivalent to a reasonably good anti-reflection coating.
 Figure
9: Picture with Split = 2 Form = -5
Figure
9: Picture with Split = 2 Form = -5
This is a logarithmic display of the flux levels from the peak, truncated at 5 orders-of-magnitude below the peak. The lowest signal displayed is 0.001% of peak.
 Figure
10: Picture with Split = 2 Form = -6
Figure
10: Picture with Split = 2 Form = -6
This is a logarithmic display of the flux levels from the peak, truncated at 6 orders-of-magnitude below the peak. The lowest signal displayed is 0.0001% of peak.